
Oliver Uberti
Author of Where the Animals Go: Tracking Wildlife with Technology in 50 Maps and Graphics
Works by Oliver Uberti
Where the Animals Go: Tracking Wildlife with Technology in 50 Maps and Graphics (2016) — Cover artist, some editions — 125 copies, 2 reviews
London: the Information capital: 100 maps and graphics that will change how you view the city (2014) 120 copies, 2 reviews
Associated Works
Who We Are and How We Got Here: Ancient DNA and the New Science of the Human Past (2018) — some editions — 996 copies, 23 reviews
Tagged
Common Knowledge
- Gender
- male
Members
Reviews
London: The Information Capital: 100 Maps and Graphics That Will Change How You View the City by James Cheshire
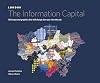
Do you like maps? Infographics? Data? London? Do you think Edward Tufte is a genius? Then do I have a book for you…
I love maps. I think they are my favorite form of decoration. They are also fascinating to me – the idea that someone figured out and then drew to scale where every little bit of a place is. One of my favorite episodes of the West Wing involves a discussion of how maps can both show data and distort it, and how that has implications for much more than just visual show more aesthetics.
This book takes all manner of data to create 100 maps and infographics that do, as promised, ‘change how you view the city.’ I was lucky enough to live in London for a year, so some of the maps might mean a bit more to me than someone who has never visited, but I think that a similar book for a city I’ve never visited (say, Mexico City, or Chicago) would still be just as fascinating.
The authors break the maps down into five broad categories: where we are, who we are, where we go, how we’re doing and what we like. In a couple of the sections, the authors take very old maps, and overlay velum with new information so you can view how things (such as the distribution of poverty) have changed. At other times they use sparklines to show how death rates have changed by each of the 32 boroughs and by cause of death. They take a survey that measured four different components of happiness and created a system so that by looking at the eyes, mouth, shading and lines tell how those components all interact, on average, by borough.
Some of the graphics are quirky and, while interesting, are worth a quick read; others I could have spent an hour pouring over. Some are also just stunning; in fact, as a birthday present my husband ordered one of the graphics, and it is being framed as we speak. Like I said, I love maps.
This book is a snapshot; it was published in fall 2014 so the information should be thought of as a glimpse in time; some of the information came from the 2011 census (the data just having been released in 2013). I hope that they will revisit this concept after the 2021 census, creating new but related infographics so we can see how the diverse city is changing. show less
I love maps. I think they are my favorite form of decoration. They are also fascinating to me – the idea that someone figured out and then drew to scale where every little bit of a place is. One of my favorite episodes of the West Wing involves a discussion of how maps can both show data and distort it, and how that has implications for much more than just visual show more aesthetics.
This book takes all manner of data to create 100 maps and infographics that do, as promised, ‘change how you view the city.’ I was lucky enough to live in London for a year, so some of the maps might mean a bit more to me than someone who has never visited, but I think that a similar book for a city I’ve never visited (say, Mexico City, or Chicago) would still be just as fascinating.
The authors break the maps down into five broad categories: where we are, who we are, where we go, how we’re doing and what we like. In a couple of the sections, the authors take very old maps, and overlay velum with new information so you can view how things (such as the distribution of poverty) have changed. At other times they use sparklines to show how death rates have changed by each of the 32 boroughs and by cause of death. They take a survey that measured four different components of happiness and created a system so that by looking at the eyes, mouth, shading and lines tell how those components all interact, on average, by borough.
Some of the graphics are quirky and, while interesting, are worth a quick read; others I could have spent an hour pouring over. Some are also just stunning; in fact, as a birthday present my husband ordered one of the graphics, and it is being framed as we speak. Like I said, I love maps.
This book is a snapshot; it was published in fall 2014 so the information should be thought of as a glimpse in time; some of the information came from the 2011 census (the data just having been released in 2013). I hope that they will revisit this concept after the 2021 census, creating new but related infographics so we can see how the diverse city is changing. show less
As someone who reads and listens to a lot of business and economic news, I would admit that there were a lot of stuff that I still didn't understand. That is why i am very thankful to this book for helping me learn tons of stuff that are very much relevant today. With its amazing data and statistical information, as well as wonderful illustrations and graphs, It even helped me learn new stuff about things that i think i already know. There are topics of course that I wish was covered more in show more depth (such as the, Asian Financial Crisis, the 2008 Financial Crisis and the Eurozone Crisis), as well as stuff that i think were missing (no specific discussion of the 1928 Wall Street Crash or the Black Wednesday 1992 Sterling Crisis). Yet, I would still have given this a five star instead of four if not for the glaring error in one of the pages where it stated that the United States, Japan and Australia sanctioned South Vietnam in 1975 (what they actually sanctioned was the unified Vietnam and not South Vietnam.) Such a glaring error of course would leave readers like me wondering, if there are other small errors in the book that he or she just read but hasn't spotted yet. Nevertheless, overall still a great book overall. Highly recommended. show less
This review is from: Where The Animals Go: Tracking Wildlife with Technology in 50 Maps and Graphics (Hardcover)
Customer review from the Amazon Vine Programme.
I am reviewing the Where The Animals Go: Tracking Wildlife with Technology in 50 Maps and Graphics by [a:James Cheshire|9883933|James Cheshire|https://s.gr-assets.com/assets/nophoto/user/u_50x66-632230dc9882b4352d753eedf9396530.png] and [a:Olive
r Uberti|9883934|Oliver show more Uberti|https://s.gr-assets.com/assets/nophoto/user/u_50x66-632230dc9882b4352d753eedf9396530.png]. Here are my thoughts:
^^ This book is about a new era, one in which the traces they follow are imprinted not in the earth but in the silicon of computer chips.
^^ Where The Animals Go mixes conservation, wildlife and habitats with the secret lives of animals as their journeys are tracked and mapped with often surprising results. It's loaded with information about the animals and their tracking data.
^^ From the "Elephant Who Texted Help", and "Jaguars Taking Selfies" (believe me, there's some great tales about these) to "The Zebras Migrating Once More", we are provided with a wealth of information involving details of national parks, reserves and wildlife management across the globe.
^^ This hardcover can be dipped into like a coffee table book, but the detail is in the data and this is where it really comes into
play, because the text makes for a fascinating read, alongside the informative maps and pictures. Some of the maps even unfold to make a larger three page spread.
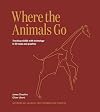
^^ If there was one thing I'd change it would be the cover, considering the information and data inside, the cover looks a bit unappealing and 70s style old-fashioned.
Overall: The information provided within is visually wonderful, with some real 'wow' insights that make this an ideal coffee table book for not only animal lovers but conservationists and conversationalists! show less
Customer review from the Amazon Vine Programme.
I am reviewing the Where The Animals Go: Tracking Wildlife with Technology in 50 Maps and Graphics by [a:James Cheshire|9883933|James Cheshire|https://s.gr-assets.com/assets/nophoto/user/u_50x66-632230dc9882b4352d753eedf9396530.png] and [a:Olive
r Uberti|9883934|Oliver show more Uberti|https://s.gr-assets.com/assets/nophoto/user/u_50x66-632230dc9882b4352d753eedf9396530.png]. Here are my thoughts:
^^ This book is about a new era, one in which the traces they follow are imprinted not in the earth but in the silicon of computer chips.
^^ Where The Animals Go mixes conservation, wildlife and habitats with the secret lives of animals as their journeys are tracked and mapped with often surprising results. It's loaded with information about the animals and their tracking data.
^^ From the "Elephant Who Texted Help", and "Jaguars Taking Selfies" (believe me, there's some great tales about these) to "The Zebras Migrating Once More", we are provided with a wealth of information involving details of national parks, reserves and wildlife management across the globe.
^^ This hardcover can be dipped into like a coffee table book, but the detail is in the data and this is where it really comes into
play, because the text makes for a fascinating read, alongside the informative maps and pictures. Some of the maps even unfold to make a larger three page spread.
^^ If there was one thing I'd change it would be the cover, considering the information and data inside, the cover looks a bit unappealing and 70s style old-fashioned.
Overall: The information provided within is visually wonderful, with some real 'wow' insights that make this an ideal coffee table book for not only animal lovers but conservationists and conversationalists! show less
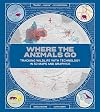
This book is not really the kind of book that should be ready cover to cover. An introductory section is followed by maps, one after the other, showing the movement of one, or a few, or many animals of a particular species. The maps vary in their presentation and are visually quite appealing.
Lists
Awards

You May Also Like
Associated Authors
Statistics
- Works
- 4
- Also by
- 2
- Members
- 272
- Popularity
- #85,117
- Rating
- 4.1
- Reviews
- 5
- ISBNs
- 10
- Languages
- 3