
Stephen Few
Author of Information Dashboard Design: The Effective Visual Communication of Data
About the Author
Image credit: Stephen Few. Photo by Francois Lamotte.
Works by Stephen Few
Information Dashboard Design: The Effective Visual Communication of Data (2006) 592 copies, 4 reviews
Now You See It: Simple Visualization Techniques for Quantitative Analysis (2009) 292 copies, 3 reviews
Information Dashboard Design: Displaying Data for At-a-Glance Monitoring (2013) 125 copies, 2 reviews
Tagged
Common Knowledge
- Canonical name
- Few, Stephen
- Birthdate
- 20th Century
- Gender
- male
- Occupations
- teacher
writer
consultant
IT innovator - Organizations
- University of California, Berkeley
- Short biography
- He has more than 20 years of experience as an innovator, consultant, and educator in Information Technology (IT). Most of this time he has specialized in the fields of Data Warehousing (a.k.a. Business Intelligence and Decision Support) and Information Design. Today, as principal of the consultancy Perceptual Edge, Mr. Few focuses on the design and use of Business information for effective analysis and communication.
- Nationality
- USA
- Places of residence
- Berkeley, California, USA
- Associated Place (for map)
- California, USA
Members
Reviews
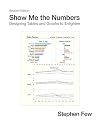
Just finished [Show Me the Numbers: Designing Tables and Graphs to Enlighten] by Stephen Few, the second edition from 2012. I'm working as an in-house editor for a biomedical research consortium, and I want to help researchers present their work more effectively. This book is a great resource for that.
The topic is inherently very dry, boring even, but Stephen Few brings a sense of fun and whimsy, starting with an excerpt from Pablo Neruda's "Ode to Numbers" before the table of contents. The show more book is divided into 14 chapters accompanied by several appendices and is written in an engaging, accessible style. The concepts are illustrated with lots of concrete example, largely from the business world, so lots of marketing summaries, sales figures, and the like.
The intro explicitly lays out the purpose and scope of the book and intended audience, and a chapter on basic stats follows. The book then proceeds through tables vs graphs, types of tables, science of visual perception and principles of graphical communication, types of graphs, general design principles for communication, then specific design principles for tables and graphs, with a detailed breakdown of design choices for each component of a graph, strategies for simultaneously displaying multiple variables, and then closes with principles of good storytelling and the balance between standards and innovation. Probably my favorite chapter is "Silly Graphs that Are Best Forsaken" (spoiler: donut charts, radar charts, stacked area graphs, circle charts, unit charts, funnel charts, waterfall charts).
Several of the chapters include hands-on exercises, both provided by the author and explicitly asking the reader to draw from their own graphs and tables from work. The pages are arranged to allow for writing in the margins, and the more extensive exercises are laid out with room for writing below each item like a workbook. References are provided in the margin, and Few is great about naming the people, not just the source titles, as well as sharing relevant quotes. He is also straightforward in expressing his own opinions and sharing his own experiences. Each chapter ends with a "summary at a glance" section like any textbook.
What I most appreciated is approaching this entire topic through the lens of storytelling and the importance of narrative. Relevant quotes:
"Information can't possibly serve a purpose until we first identify what's meaningful then manage to make sense of it."
"Unless we give information a clear voice, its important stories will remain unheard, and ignorance will prevail."
"We derive great value from the stories that numbers tell, yet we rarely consider the significance of how we present them."
"We must design the message in a way that leads readers on a journey of discovery."
"Quantitative stories are always about relationships."
"Before stories can be told, they must be discovered and understood. Data sensemaking precedes data presentation."
This is a great resource for approaching visual aids with intention and thought instead of just relying on the default settings of spreadsheets and/or graphing software. It can help anyone become a more effective presenter and design better visual aids. show less
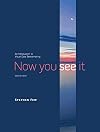
We live in an era, the so-called Information Age, where data collection has become incredibly easy. The term “Big Data” gets thrown around casually as computers collect more information on us than we know how to process. Yet wise interpretation of those data is often elusive. We’re overwhelmed with it. Effective visualizations and charts can help us interpret it better, whether to present and persuade or to monitor and manage. Stephen Few, an eloquent minister-turned-data guru based in show more Silicon Valley, teaches us how to approach and use data from the beginning levels.
Professionally, I write software for biomedical applications that use a lot of scientific visualizations for large datasets. Although I took several nuggets of knowledge from this book (e.g., q-q plots), it was not really written for an audience like me. It’s more geared towards the wider business community, for whom data collection is a way to manage engineered systems. Rigorous biomedical scrutiny of data through careful statistics is simply not covered in this book. While for most, this tendency is surely welcomed, I honestly missed the exacting statistical theory. Still, I suspect most readers will find this book very approachable with achievable aims… even when using a common spreadsheet program.
Situated in Silicon Valley, Few clearly addresses an audience of those developing software with visualization technologies. Many times, he explicitly suggests features for new products. For software geeks like me, this trait is welcomed, but I understand that many business users, more interested in interpretation, might find it a bit off-putting. Nonetheless, I suggest it unwise to discard this whole book solely for that trait. This is the second book I’ve read by Few, and he consistently teaches me how to visualize and think about data in new ways – even as a scientist who is not deeply involved with business’s “bottom line.”
Like many books on data visualization, this work is elegantly put together with color plates communicating graphs as models. It’s simply a well-produced, pretty book. Business readers, especially decision-makers, can and should take advantage of Few’s expert wisdom. Learning a handful of pearls can easily lead to increased performance. Those involved in visualization software and the still young field of data science can likewise gain insights from Few. Again, the statistics are light, so wider audiences can access this work without intimidation. I enjoy wrestling with an active, expressive mind like Few’s and am grateful for my experiences with his writing. show less
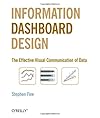
Great book on how to design informational dashboard. The author introduced a lot of great visual theories that made so much sense. He created a dashboard design competition, judged and then used the examples as teaching point in his book. A lot of examples on terrible dashboards, and also how to fix those. This book has helped me tremendously with leveling my visualization skills.
Dashboards are a hot topic in our information-laden world. They are imagined by those in the design world (often very poorly) and implemented by programmers who do not take their imagination any further. This book, written by an acknowledged expert in the field of visualization, describes how to design dashboards that communicate essential data to users, mostly business-people. As such, its audience consists of designers, not programmers. Although I am a programmer, I enjoy "cross-training" show more my imagination by thinking in the intellectual "boxes" or "bins" of those around me.
Few introduces standard graphs and a couple new ones (bullet graphs and sparklines). He explains the use of each in standard fashion. His real contribution, after explaining the fairly standard song-and-dance, is through the introduction of these new graphs, one of which he invented. I was curious to try to implement these two graphs using R's ggplot. Although I have no immediate use for these types of graphs, it's nice to have new tools in the box of memory to explain people's data accurately and effectively. show less
Few introduces standard graphs and a couple new ones (bullet graphs and sparklines). He explains the use of each in standard fashion. His real contribution, after explaining the fairly standard song-and-dance, is through the introduction of these new graphs, one of which he invented. I was curious to try to implement these two graphs using R's ggplot. Although I have no immediate use for these types of graphs, it's nice to have new tools in the box of memory to explain people's data accurately and effectively. show less
Lists
Awards


You May Also Like


Statistics
- Works
- 7
- Members
- 1,549
- Popularity
- #16,623
- Rating
- 4.0
- Reviews
- 15
- ISBNs
- 9