
M. E. J. Newman
Author of Networks: An Introduction
About the Author
Disambiguation Notice:
Do not combine M. E. J. Newman with Mark Newman because Mark Newman is a split author.
Works by M. E. J. Newman
Tagged
Common Knowledge
- Gender
- male
- Nationality
- UK (birth), USA (resident)
- Disambiguation notice
- Do not combine M. E. J. Newman with Mark Newman because Mark Newman is a split author.
- Associated Place (for map)
- UK
Members
Discussions
A different way of looking at things in Maps and Atlases (February 2009)
Reviews

This amazing book should be in every home and in every library where there are students or people who wish to understand more about the world in which they live. The 366 colored maps bring reality to all the statistics that we hear on a daily basis.
For example: if you would like to compare world usage of automobiles, look up the map! The countries with more usage are swollen and enlarged, the countries with less are shrunken. It gives you answers "at a glance"
(edited to include example)
For example: if you would like to compare world usage of automobiles, look up the map! The countries with more usage are swollen and enlarged, the countries with less are shrunken. It gives you answers "at a glance"
(edited to include example)
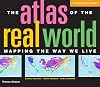
On the surface, this atlas is composed of world maps with a different distortion on each page. The actual attempt is tp even out what ever prime subject a given ap is trying to show. So, the first map in the book shows each country with its area correct in proportion to each other, unlike Mercator, which is very distorted to the poles. The second map shows population size in correct relation for each country. So, India hugely dominates South Asia and Nigeria dominates Africa. On the other show more hadn, an unpopulated place like Alask shows up with a thin sliver as does the Siverian section of North Asia. The third map shows the population from Year 1, with India and Chna dominating. By 1500 in the fourth map, Europe has grown quite a bit relatively.
Highly distorted looking maps can be seen at 109 - Gas and Coal Exports and 110 - Gas and Coal Imports. Canada dominates North Americ in # 109 and the U.S.. dominated # 110.
The intent of this "real world" atlas is to show how unevenly distributed are natural resources, economic activity, and social situations around the blobe. This book is well worth pouring through and is very revealing. Each region has its own color to help you find where places are. show less

NBD|Biblion recensie
De 'Atlas van de dagelijkse wereld' biedt een enorme schat aan statistische informatie over 366 historische, actuele en toekomstige trends in diverse alledaagse onderwerpen. Deze onderwerpen zijn gebundeld in een zestal hoofdstukken: de wereld van de hulpbronnen, de wereld van de handel, de wereld van de economie, de sociale wereld, de wereld van de gevaren en de wereld van het milieu. De informatie is weergegeven in cartogrammen, waarbij de grootte van de landen show more verhoudingsgewijs overeenkomt met de waarde van de in kaart gebrachte onderwerpen. Ondersteund door grafieken, tabellen, informatieve tekst en citaten geven deze cartogrammen een verrassende indruk van de (toenemende) ongelijkheid in de wereld. De bijzondere wijze van karteren doet echter wel concessies aan de vorm van de landen, en dat komt de effectiviteit van de cartogrammen zeker niet altijd ten goede. De atlas bevat een uitgebreide inhoudsopgave, een beknopte introductie tot de cartografie en tot cartogrammen in het bijzonder, een bronnenoverzicht en een verklarende woordenlijst. Een register ontbreekt. Uitgave in groot oblong formaat.
(NBD|Biblion recensie, Drs. E.L. Poppe) show less
Lists
You May Also Like


Associated Authors
Statistics
- Works
- 6
- Members
- 528
- Popularity
- #47,120
- Rating
- 3.8
- Reviews
- 4
- ISBNs
- 29
- Languages
- 3