The Data Detective: Ten Easy Rules to Make Sense of Statistics
by Tim Harford
On This Page
Description
"Today we think statistics are the enemy, numbers used to mislead and confuse us. That's a mistake, Tim Harford says in The Data Detective. We shouldn't be suspicious of statistics-we need to understand what they mean and how they can improve our lives: they are, at heart, human behavior seen through the prism of numbers and are often "the only way of grasping much of what is going on around us." If we can toss aside our fears and learn to approach them clearly-understanding how our own show more preconceptions lead us astray-statistics can point to ways we can live better and work smarter. As "perhaps the best popular economics writer in the world" (New Statesman), Tim Harford is an expert at taking complicated ideas and untangling them for millions of readers. In The Data Detective, he uses new research in science and psychology to set out ten strategies for using statistics to erase our biases and replace them with new ideas that use virtues like patience, curiosity, and good sense to better understand ourselves and the world. As a result, The Data Detective is a big-idea book about statistics and human behavior that is fresh, unexpected, and insightful"-- show lessTags
Recommendations


Member Reviews
This book is an interesting and thought-provoking read—especially in this age of misinformation, fake news, & intense political division. It lists out 10 rules to make sense of statistical claims. It all boils down to being curious. Curious about your own emotional response, curious about the data itself, curious about the context, curious about the process, curious about the intentions of the author, etc. Having an open-mind, a curious mind is one of the most powerful tools one can have.
I loved all the historical anecdotes & psychology experiments cited. Florence Nightingale was an absolute badass and now my new role model—a fearless data queen!!!!
This book did take me a while to finish. I got into a routine of reading one show more chapter after finishing a lesson in my data courses at work—so I read it over the course of a few months while finishing the Google Data Analytics Certificate. I annotated it (of course) and it’s interesting to see the annotations in the margins. Almost a timeline of sorts depending on what events were playing out at that time. And since I read it in conjunction with learning about the data analysis process, I was able to put the insights from this book into practice with my Capstone. I love a full-circle moment!!!
Lastly, I realized with this book how much I do not know about the world. I am vastly uneducated on most government policies, political history, and general pop culture knowledge. I find myself more motivated to read about history (especially recent history like 1980s & on). I really enjoy reading nonfiction because I can learn the WHY behind a lot of the structures in place today. Unfortunately (or fortunately depending on your perspective), that means I’ll be picking up some political history books and probably be insufferable to talk to lmao.
A “boring” book that I (a self proclaimed data nerd) thoroughly enjoyed reading and learning from. My only complaint (and reason it didn’t get 5 stars) is that it did feel a bit redundant at times. Like the author needed to meet a certain page amount. It was nice since I read it over such a long period of time (for me) that there was such repetition, but reading multiple chapters in one sitting it got very tedious. show less
Like Gladwell if Gladwell was humble, witty, and probably true. Hardford is refreshingly skeptical about his own "turns out…" tendencies. The book is larded with great little quotes and turns of phrase, and when I got to the end I somehow felt this was not just a tour of statistical thinking but a philosophy of life: be curious, question assumptions, don't be a cynic, look for what's left out. Encouragement in these depressing times.
Harford starts out by noting that, while Darrell Huff’s How To Lie with Statistics was important, it also can be used to undersell the importance of the right statistics. Darrell Huff, in later years, wrote a sequel (never published) called How to Lie with Smoking Statistics, as he was paid to do. “Yes, it’s easy to lie with statistics—but it’s even easier to lie without them.”
But how do you know whether you have the right statistics, correctly measured? Harford advocates both reflection on your own experience and on what else might be known—being willing to update your priors, as it were. Pay careful attention to what is being counted. For example, Harford explains that some—but by no means all—of the high infant show more mortality in the US seems to be “the result of recording births before twenty-four weeks as live when in other countries they would be recorded as miscarried pregnancies.” Doctors in different places, that is, are different in the likelihood that they will record a pregnancy that ends at twenty-two weeks as a live birth, followed by an early death, rather than as a late miscarriage. Now we need more information, such as late miscarriage rates in various countries, to get a fuller picture. But: “For babies born after twenty-four weeks, the US infant mortality rate falls from 6.1 to 4.2 deaths per thousand live births. The rate in Finland barely shifts, from 2.3 to 2.1.” So there is something going on with how deaths are counted.
Harford also discusses the replication crisis in psychology and the effects of publication bias. As he points out, data are themselves subject to survivor bias; he notes that the blockbuster book “In Search of Excellence” offered management lessons from studying forty-three of the most outstanding corporations of that time, but within two years, a third of them were at least financially unstable.
His contrarianism also takes him down less fruitful paths. For example, he says, “Very few people have enough wealth to fund their lifestyle purely out of interest payments, and so if we want to understand how inequality manifests itself in everyday life, it makes sense to look at income rather than wealth.” Um, no; doing that makes it harder to understand why Black families get worse mortgages and live in worse neighborhoods than white families with the same income. Likewise, his generic endorsement of curiosity doesn’t account for the way that “do your own research” misinformation (Qanon, vaccine denial) works. But I was interested in the research he reported in which people were asked to rate their understanding of various political issues on which they had opinions on a scale of one to seven and then asked to elaborate on what they understood. Apparently, after doing this, “people became less likely to give money to lobby groups or other organizations that supported the positions they had once favored.” show less
Very well written guide to help average people read, understand, and question statistics they may run across. Totally non-technical, with gentle understated humor, there are no formulas and nothing to frighten a math-phobe. He also makes it clear he’s not out to debunk statistics. His position is that statistics are a great tool to understand reality, but they’re frequently imperfect, so it’s good for us non-technical people to understand how they can go wrong. He ends up with a nice chapter about how as consumers of statistics our best strength is our curiosity. (In my reviews I often carp that the last chapter or two of non fiction books are substandard - not with this book, it’s uniformly enlightening and enjoyable to read.)
Rather than throwing out all statistics as lies, this book aims to arm the reader with skills that can make sense of statistics instead. Honestly, I found it to be very much like other books I've read about statistics, except laced with optimism. I found the author's takedown of social psych studies important, but felt a little annoyed when he justified some of his arguments with them. (One of them I had serious questions about how the researchers were able to group people into different subjective categories -- I was sick while reading the book, so did not keep good notes.)
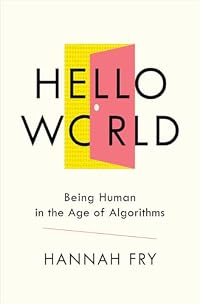
Definitely a good read if you're interested in the "lies, damn lies and statistics" debate. Also worth reading: Hello World: Being Human in the Age of Algorithms, show more Statistics Done Wrong: The Woefully Complete Guide, and The Matter of Facts: Skepticism, Persuasion, and Evidence in Science. show less
Definitely a good read if you're interested in the "lies, damn lies and statistics" debate. Also worth reading: Hello World: Being Human in the Age of Algorithms, show more Statistics Done Wrong: The Woefully Complete Guide, and The Matter of Facts: Skepticism, Persuasion, and Evidence in Science. show less
In this book, Tim Harford gives us ten rules to help us make sense of statistics. No statistical training is required, just asking the right questions. The book is very well structured, written clearly and accessibly, and contains lots of examples. It required a rewrite during the publishing process to bring in COVID-related statistics. I liked particularly that this book name-checked Caroline Criado Perez’s Invisible Women and Alberto Cairo’s How Charts Lie, both of which were very good indeed.
I am a huge fan of 'More or Less', the radio show/podcast presented by Tim Harford and so was keen to read this book. It didn't disappoint. There have been some reviews opining that Harford is the British Malcolm Gladwell and I can see the comparison but that does not make Harford's work any less valuable. For someone who loves statistics and the stories they can tell, this book is dynamite!
Members
- Recently Added By
Lists

Penguin Random House
458 works; 4 members
Author Information

26+ Works 7,434 Members
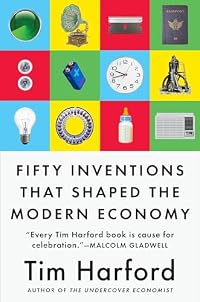
Tim Harford is an award-winning columnist, broadcaster, and economist. He is the author of Messy, Fifty Inventions That Shaped the Modern Economy, and the million-selling The Undercover Economist, and is the host of the .Cautionary Tales podcast. He is an honorary fellow of the Royal Statistical Society, and in 2019 he was awarded an OBE for show more services to improving economic understanding. show less
Awards and Honors
Common Knowledge
- Original title
- How to Make the World Add Up
- Alternate titles
- The Data Detective: Ten Easy Rules to Make Sense of Statistics
- Original publication date
- 2020
- Dedication
- To teachers everywhere, and my teachers in particular; in fond memory of Peter Sinclair
- Disambiguation notice
- Published in the UK as How to Make the World Add Up, and later in the US and Canada as The Data Detective.
Classifications
Statistics
- Members
- 670
- Popularity
- 42,683
- Reviews
- 16
- Rating
- (4.01)
- Languages
- Dutch, English, Portuguese, Spanish
- Media
- Paper, Audiobook, Ebook
- ISBNs
- 13
- ASINs
- 6