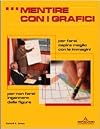
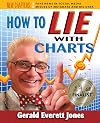
How to Lie with Charts
by Gerald Everett Jones 
On This Page
Description
This is the ideal guide for executives, professionals and support staff who want to understand how presenters can use charts to deceive an audience. It is full of examples drawn from the real world.Tags
Recommendations
















Member Recommendations

Member Reviews
I’d won a PDF.file copy of this book from the author through a giveaway he had on LibraryThing; but chose to read it via an Amazon KINDLE Unlimited [KU] download because I prefer reading the KU format.
There’s hardly anyone who hasn’t heard the phrase, ‘Figures don’t lie, but liars figure’; a phrase which had been originated by Samuel Clemens otherwise known as Mark Twain. With this said, what the author, Gerald Everett Jones, has done here in the Fourth Edition of his book, is to show readers how this gets accomplished.
One should look at this book as being the quintessential place to go to in learning how this statistical deception gets accomplished through the visual tools which we know as charts. Regardless of the design show more of the chart, and there are several, the ultimate goal of charts is to show a particular set of data which has been extrapolated from a massive complete database. However, at times creating the chart from this limited dataset can cause data being to be unintentionally/intentionally corrupted which might lead to bad decisions being made by the chart’s users.
There is a dichotomy of the lie regarding charts in this book. While on one hand it offers ways in which data can be manipulated to create a lie, on the other hand it gives insights to the readers of this book in discovery the lies which a chart might contain. Charts are meant to offer clear visualizations of data without being encumbered with soporiferous information. Knowing the innerworkings of charts can prevent individuals from being hoodwinked and at the same time help individuals in making their desired arguments effectively.
And with figures never lying, and liars figuring, it’s always an advantage in knowing what the deal is regarding any chart, which is what this book tries to accomplish for its readers, and why I’ve given Mr. Jones for this current, updated version of his book, “How to Lie with Charts – 4th Edition. show less
There’s hardly anyone who hasn’t heard the phrase, ‘Figures don’t lie, but liars figure’; a phrase which had been originated by Samuel Clemens otherwise known as Mark Twain. With this said, what the author, Gerald Everett Jones, has done here in the Fourth Edition of his book, is to show readers how this gets accomplished.
One should look at this book as being the quintessential place to go to in learning how this statistical deception gets accomplished through the visual tools which we know as charts. Regardless of the design show more of the chart, and there are several, the ultimate goal of charts is to show a particular set of data which has been extrapolated from a massive complete database. However, at times creating the chart from this limited dataset can cause data being to be unintentionally/intentionally corrupted which might lead to bad decisions being made by the chart’s users.
There is a dichotomy of the lie regarding charts in this book. While on one hand it offers ways in which data can be manipulated to create a lie, on the other hand it gives insights to the readers of this book in discovery the lies which a chart might contain. Charts are meant to offer clear visualizations of data without being encumbered with soporiferous information. Knowing the innerworkings of charts can prevent individuals from being hoodwinked and at the same time help individuals in making their desired arguments effectively.
And with figures never lying, and liars figuring, it’s always an advantage in knowing what the deal is regarding any chart, which is what this book tries to accomplish for its readers, and why I’ve given Mr. Jones for this current, updated version of his book, “How to Lie with Charts – 4th Edition. show less
This review was written for LibraryThing Member Giveaways.
A straightforward introduction to charts and graphs and the means by which they can be manipulated in order to deceive and obfuscate. The examples are not as pointed as the ones in the classic How to Lie with Statistics, and the author occasionally makes digressions into discussing charts and graphs in general, or how spreadsheets work, wandering far from the basic purpose of the book. The typesetting (at least in my edition) is also poor, with some examples given in an obviously pixelated font and many of the backgrounds being halftoned in ways that don't match the resolution at the printer's. Overall an interesting read, but it could have been a lot tighter; I had the impression the author needed to make page count.
This is supposed to be a really useful book that Dick wanted me to read. I read some of it and I bought my own copy so I can read it at the ranch some time.
Ratings
Members
- Recently Added By
Author Information

35 Works 200 Members
Gerald Everett Jones is a LibraryThing Author, an author who lists their personal library on LibraryThing.
Common Knowledge
- Canonical title
- How to Lie with Charts
Classifications
Statistics
- Members
- 67
- Popularity
- 467,057
- Reviews
- 3
- Rating
- (3.64)
- Languages
- English, Italian
- Media
- Paper, Ebook
- ISBNs
- 5
- ASINs
- 1